Project #3 Generative Fiction
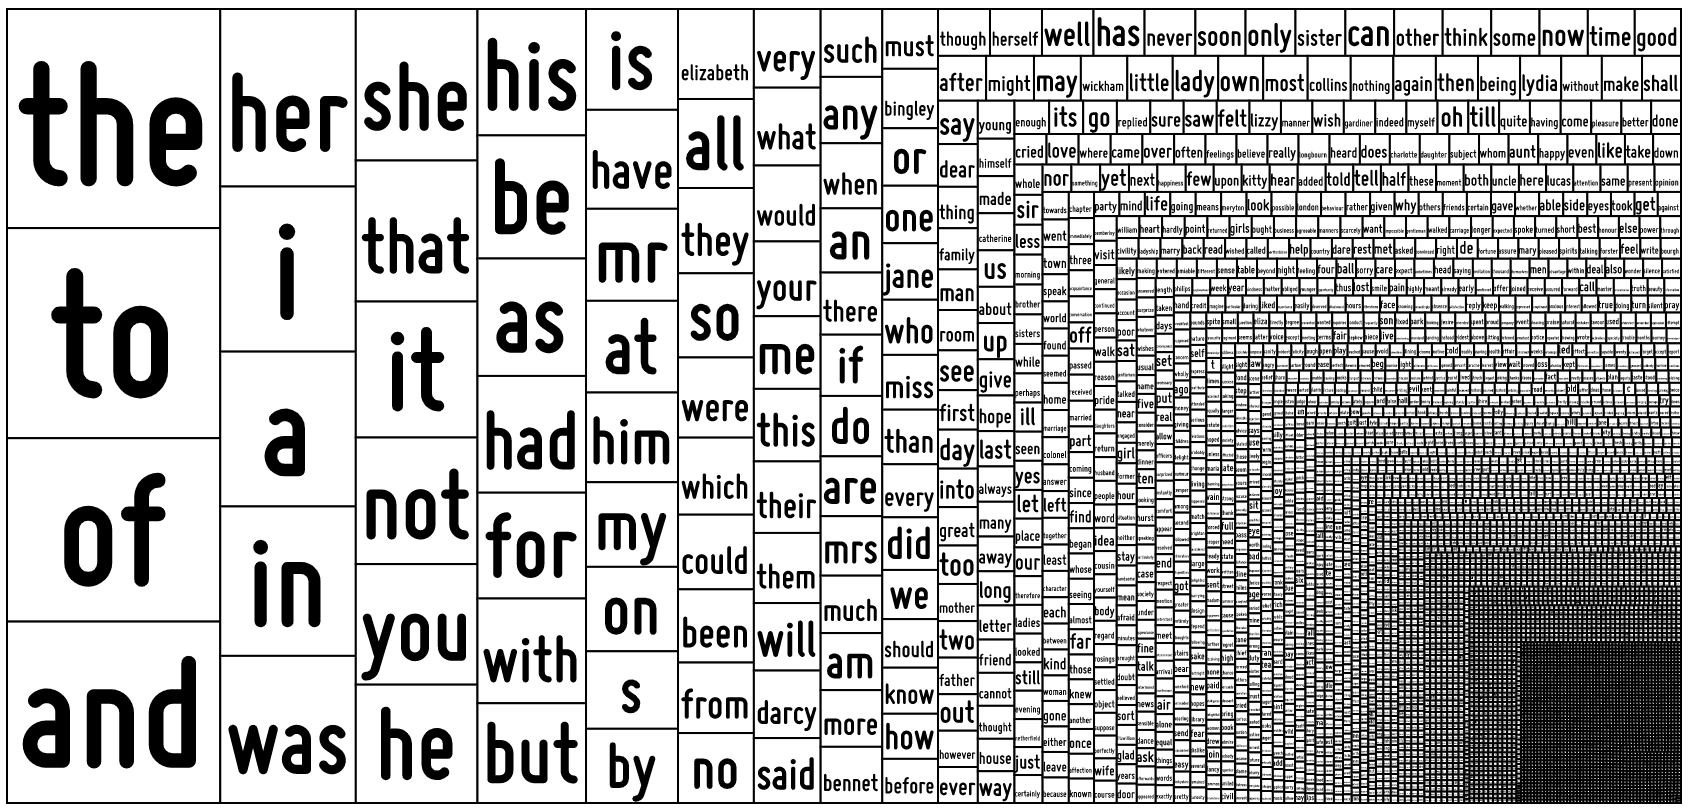
Image from Generative Design
“It is very easy to pour 10,000 bowls of plain oatmeal, with each oat
being in a different position and each bowl essentially unique, but it
is very hard to make these differences *matter* to an audience, and be
perceived as truly different in any memorable or thought-provoking way.”
— @dryman
Description
For Project #3, you will create a generative short story with a clear beginning, middle, and end. Your goal is to make a highly re-readable story that would make your readers (me and your peers) want to re-read it over and over again. Your story should be at least 750 words (equivalent to 1.5 pages). Your choice of words, layout, and interaction should thoughtfully reflect on the structure and greater meaning of the story.
Required Reading
(1) So you want to build a generator…, Kate Compton
References
(1)
AI Dungeon
by Nick Walton, built on GPT-2
(2)
NaNoGenMo (National Novel Generating Month) Archive, 2019
(3)
The Annals of the Parrigues, Emily Short — procedurally generated guidebook to a fictional
pseudo-English kingdom, along with a making-of commentary on the process
of generation.
(4) RiTa.js Gallery
(5)
Shanshui, Chen
Qianxun
(6)
If We Were Alllowed to Visit, Ian MacLarty
(8)
The Crying Game, Sophie Mallinson
Resources
(1)
Corpora, Darius Kazemi
and Many Wonderful Contributors
(2)
API List — a public list of
free APIS for programmers
(3)
CSV Files (tutorial), Allison Parrish
(4)
Rita.js tutorials
(5)
JavaScript Strings
Timeline & Deliverables
Feb 26: Submit proposal slideshow for your generative fiction to Canvas.
The proposal should include an overall description of your story and a
narrative diagram showing various versions of the story. Address
conceptual / aesthetic goals as well as technical steps and submit it to
canvas
March 4: Complete white-boxed version of the project for peer-reading
session. Your sketch should generate a story of at least 750 words.
March 11: Project due, present in class
Submission Guidelines
Submit proposal and white-boxed version of your project to Canvas
Submit your finalized sketch to Canvas as well as the
Project #3 Glitch page
for presentation purposes
Design Constraints
(1) Your canvas size should be 600px * 600px
Study Guide
Table of Content
(1) Working with Local Data
(2) JavaScript join()
(3) JavaScript substring()
(4) Bonus Feature: User Input
(5) Working with External Data
(6) Working with API
(7) RiTa.js
(8) Sin() and Cos()
Working with Local Data
Loading & Displaying Data
loadTable() is a p5 function that reads the contents of a CSV file and creates a p5.Table object with its values. The CSV file must either be located in the sketch's folder or elsewhere online.
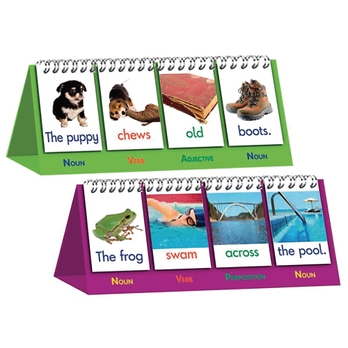
Using loadTable() with a local CSV file, let's try to recreate the "sentence flip book" children often use to learn how to construct sentences. First, open your desktop spreadsheet software (e.g. Excel) or Google spreadsheet, and let's create a couple possible sentences for the flip book. In the example below I'm using a name, a verb, and a food item to construct every sentence. Keep in mind that these sentences must follow the rules of modular design, so that different combinations of the words would still make out logical sentences.
Once you're done with that, download the spreadsheet as a CSV file, and upload it to your p5 sketch folder. When you click on the CSV file inside the p5 editor, you should see something like this:
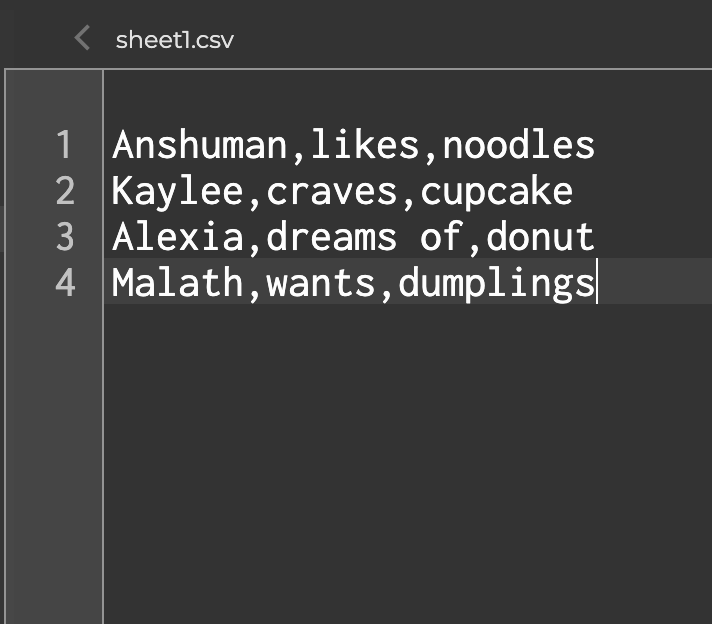
If you look carefully, you might notice that every new line creates a new row, and every comma creates a new column. You can edit your CSV file inside the editor if you decide that something needs to change.
Great! Now let's load the table into the sketch! Just like loading any other files in p5, you need to load the CSV file using function preload(). Also, inside the p5.Table object, there are a couple methods you should know about in order to properly load and display the data:
- getString(row, column): retrieves a String value from the Table's specified row and column. Based on the example above, getString(0,0) will retrieve the word "Anshuman", and getString(3,2) will retrieve "dumplings"
- getColumnCount() or getRowCount(): returns the total number of columns or rows in a Table. It's used in a similar way as array.length
↳ click to randomize sentence
To put it all together, I have used random() to generate three different row numbers within the range of getRowCount() at the start of the sketch as well as when every time mouse is pressed. And I use text() three times to load the possible sentences individually:
So while you're trying this out on your own, you might have noticed that a couple lines are being repeated a couple different times to do similar things. You could try to combine them into for Loops to write less lines of code. However, you'd need to turn your row1, row2, and row3 variables into a row[] array in order to load them properly. Here's the optimized version of the code above.
Overwriting Data
Now that we know how to load data from a CSV file and turn it into a p5.Table object. Let's learn how to overwrite a cell value inside a table object using set(row, column, value). Add the lines below to the end of setup() inside the previous code example:
Now when you click on the screen, you should see that column 0 - row 0 has now been set to "Chloe":
Link to Source CodeThere are many other methods you could use under p5.Table that goes beyond what has been mentioned above. Take a look at them to get a sense of what's possible.
JavaScript join()
In the examples above, each word has a position X and Y. What if we want to connect the words together so that there are no spacings in between? This is where JavaScript join() comes in handy. join() is a method that connects all the items inside an array together to form a string. For instance, copy & paste the code below into your p5 editor:
Now try to replace sentence.join(" ") to sentence.join("-"):
You will see that console now prints 'I-<3-programming'. Essentially, join() makes all the items inside an array hold hands with each other!
Next, let's add join() and splice() to our previous example, so that when mouse is pressed, splice() will add sentences to an empty array, and join() will help to format the sentence.
↳ click to add sentence to the array
Link to Source CodeJavaScript substring()
The substring() method lets you access and load part of a string. The method takes up to two parameters: the start of the index and the end of the index. By using this method, we could create a typewriter effect inside our sketch. This makes the reading experience more engaging and less daunting, especially when you're displaying a large amount of texts:
↳ click to see the typewriter effect
Link to Source CodeBonus Feature: User Input
If you want to incorporate user's input, such as a character's name into the story, you could add a text field using createInput() and a button using createButton() for text submission. This get into accessing the HTML DOM, which will be covered extensively in the next project. So don't worry if you feel like you don't completely understand how it works on the backend for now.
Let's start by creating a button that will let us randomize the background color every time it's pressed. The first step is to simply create the button, and make the button display a string to indicate what it does:
Now you've got a clickable button, but the button doesn't do anything yet. So let's add another line of code inside setup() that will make the button executes a function:
And let's create function changeBG() and define what is supposed to happen when the function is executed:
Neat! Now when you pressed the button, it should randomly changes the background color. Next, let's change the position of the button so that it's overlapped with the sketch. For this, you would have to go to your style.css file inside the data folder. Add the following lines to the file:
Your sketch should looks like this:
Link to Source CodeThere are many other options for styling the CSS button. You can learn more about them HERE and try it out in your sketch.
Next, let's add a text field so that when the user enters their name into the program, it will be stored inside an array. Besides the text field, we also need a button so that the user can submit their text. Let's start by creating the variables:
And then create the text field and the button inside setup():
The next step is to create a function called addName, and use splice() to add a new name into our empty array every time function addName() is executed.
Try to enter a couple names into the text field. Because we've set splice() to delete one item every time it's executed,, you should see the new name replacing the old name. Now let's display this information inside draw():
And finally, let's style the text field and the button inside style.css so that they would be overlapped with the sketch. You can take a look at CSS Forms to learn more about styling the text field.
Your sketch should look like this:
Link to Source CodeWorking with External Data
Working with external data is a huge topic. There are endless amount of data on the internet we could possibly draw from, and the topic of your story could really determine what kind of data you would be searching for. As of today, CSV, XML, and JSON are the most commonly seen data format on the web. CSV is older and still widely used in the fields of science, while JSON is newer and widely used in commercial applications.
Intro to JSON
JSON stands for JavaScript Object Notation. It was derived from JavaScript and therefore looks similar to a JavaScript object literal, however JSON is an independent data format and uses the extension name .json! I'm not expecting you to become a fluent JSON programmer through this project, however, since JSON is going to be one of the most common data format you will be encountering online, let's learn about the basic JSON syntax so that we are not totally lost when we encounter this type of external data.
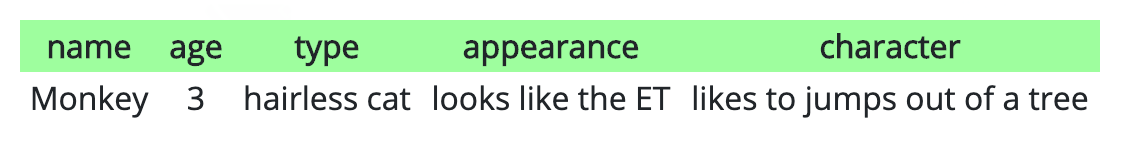
Let's say I'd like to create a profile for a cat I've met in Portland, Oregon last summer. On a spreadsheet it would look like this:
As a JavaScript object literal it would look like this:
And as a JSON object it would look like this:
The outer pair of curly brackets (line 1 & 10) indicate the begining and closing of the JSON object; and the inner pair of curly brackets (line 3 & 9) indicate an object within an object.
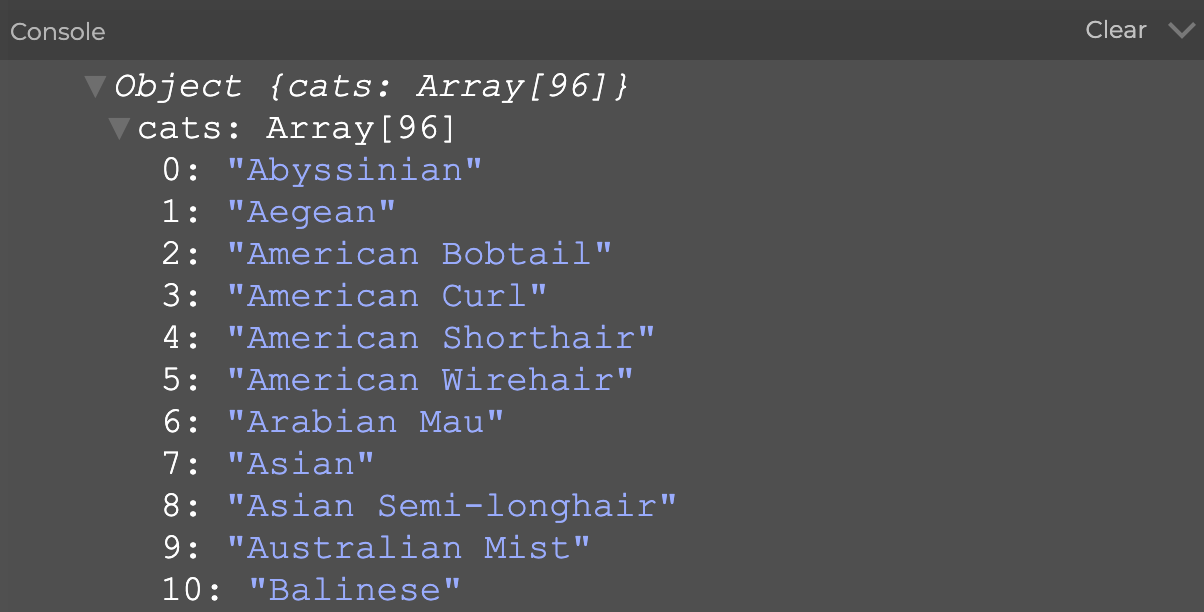
Next, let's take a look at Darius Kazemi's wonderful project Corpora, a repository of JSON files containing words ranging from the animals to the government. Let's use the cats.json file in the repository for our next example. Similar to loading the CSV file, we're going to load the JSON file in p5 preload() using loadJSON():
When catObj gets printed into your console, you should see that there is an array called cats living inside the JSON object. This is an important piece of information that would help us access the specific cats inside the array in the next step.
Now we can use a dot operator to access deeper layers of the JSON file:
Here's a developed version of the sketch that would choose a random cat from the list and use it inside a sentence:
The entirety of JSON syntax is basically made up of objects {} and arrays []. The basic idea is simple but the structure could get really complicated when the amount of data is large. If you're interested in learning more, read about nested arrays and nested objects here.
Working with API
What is an API?
API stands for application programming interface. It consists of pre-written commands that allow two different pieces of software to speak to one another. Allegorically, API is like a bird whistle that helps human (software 1) to communicate with birds (software 2). When we work with an API over the web, we are most likely trying to retreive some form of data from a server into our p5 sketch. For example, let's say we would like to retreive live weather data from the Open Weather Map. In order to do this, we need to check whether it's got an API, and most importantly, whether the API is well documented with clear instructions for how to use it. You should refrain from using an API that has vague instructions.
What is an API key?
In order to proceed with your API journey safely, you need an API key. You can think of an API key as a password that has been randomly generated for you by the server in order for you to access its database. Every time your program runs, you'd be making a request to the server to send data over. Before the server sends the data back to you it would asks for your API key. Usually, you would generate a new API key for every software you create. And you can cancel / delete the API key when the software is no longer in use. A more detailed explanation can be found in this video:
Next, walk through the process of signing up and obtaining an API key from Open Weather Map. And let's move into p5 editor to implement the API!
Implementing the API
Take a look at the instruction for making an API call on Open Weather Map, and you should see that this is how you'd make an API call (just like a bird call!):
api.openweathermap.org/data/2.5/weather?q={city name}&appid={your api key}
When you adapt the call for your own use, you need to swap {city name} to the name of your city (e.g. New York) and {your api key} to your API key. Paste the line into the URL field inside your browser and you should see raw JSON data that shows the most updated information on the current weather. Amazing!
Now let's take this info into p5. First, we'll use a variable to hold the URL for our API call. And we'll load in using loadJSON():
Next, let's create a function called getData. This function will handle the JSON object that is retrieved when setup() is executed.
Now, when you print data inside getData(), you should see the JSON data inside the console. Use dot notation to access deeper layers of the data. For instance:
Here is another example of an API implementation, using Wordnik's API. It lets you access various types of dictionary data:
Link to Source CodeRiTa.js
RiTa.js is a powerful external JavaScript library that is made for creating digital literature. It is connected to a lexicon and can do things such as generating verbs, nouns, and adjectives; generating words that sound similar to each other or rhymes with one another. RiTa.js is a good way to add a cherry on the top of your generative story, but it isn't a good tool to create your entire story — it's your job to do that.
The first step is to load RiTa.js in the p5 editor. Visit https://cdnjs.com/libraries/rita and copy the URL for the version of RiTa.js you'd like to use for the sketch. You might notice that the page is hosted by cdnjs, this is an open-source, community-driven project that hosts all the popular libraries online so that you do not need to manually download them to your sketch folder. You can learn more about CDN here.
Let's create a new sketch and open your index.html file. Right underneath the <head> tag let's add this line:
Congratulations! You have just added a new JavaScript library into your program! Now visit the reference page for RiTa.js and see what you could do with it.
RiTa.similarBySound
RiTa.similarBySound() lets you enter a word and it would return with all the words in the lexicon that sound similar. For example, I have enetered the word "code" into the program and this is the output:
Here is the source code for my sketch:
Sin() and Cos()
Polar Coordinates System
Before getting into sin() and cos(), we need to first learn about a different kind of coorinates system called the polar coordinates system. So far we have only been using the Cartesian coordinate system to define positions on a canvas. For instance, if your friend is looking for you in Union Sq, you can describe your x, y positions using the Cartesian coordinates:
.jpg?v=1583618624773)
There is however another way to describe positions by using something called the polar coordinates system. Polar coordinates take two parameters — distance and degrees. So instead of telling your friend that you are at -3 units on the x-axis and 2 units on the y-axis, you could also say that you are located at 150 degrees and 2 units away from the center:
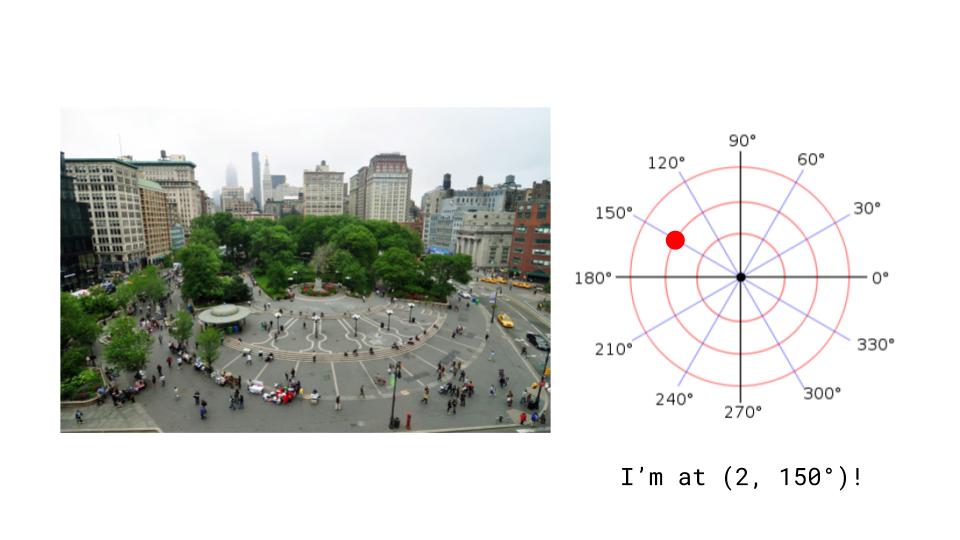
The syntax for polar coordinates then is (distance, degrees). The degree parameter here is also known as theta, represented by the symbol θ.
Polar to Cartesian Conversion
When we need to animate something along the radial path, it's much easier to think about the drawing in polar coordinates terms. However p5.js only understands Cartesian coordinates, therefore we need to convert polar coordinates into Cartesian coordinates using the following equations:
x = r * cos(theta);
y = r * sin(theta);
r here stands for radius. And when you pair up x with cos() and y with sin(), you're able to animate on the degree axis in the clock-wise direction:
Now that you've learned the standard equations to move something in a circular motion, try tweaking the code example above in the following ways and compare different results:
- Replace cos() to sin() and sin() to cos() inside the code
- Replace all the cos() inside the code to sin()
- Replace all the sin() inside the code to cos()
What has happened and why is it happening? What are these strange things called sine and cosine? Let's take a deeper look into what's happening behind the scene.
Sine and Cosine
The most difficult part of learning sine and cosine is coming to understand that these terms are used to describe the relationship between two sides of a triangle — they are not something directly observerable on the canvas.

If that's already sounding extremely obscure to you, try to go through this brilliant excercise on Math is Fun. What you should learn by the end of the excercise, is that sine wave essentially offers a set a numbers to us that infinitely between 1 and -1. And we could utilize this set of numbers to draw things on circular or wavy paths.
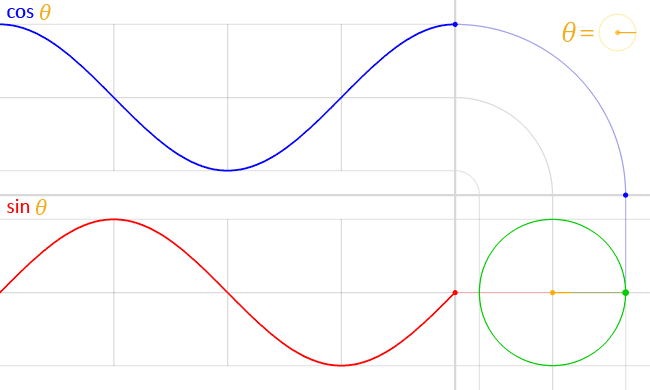
Cosine, on the other hand also offers a set of numbers between 1 and -1 for us to use in our code. Observe the image above to see the different wave forms and positions produced by sine and cosine under the same theta.
In the previous example code, when x is combined with cos() and y is combined with sin(), you get to draw things in a clock-wise, circular motion. And when x is combined with sin() and cos() is combined with y, you get to draw things in a counter-clock-wise, circular motion. Here's a sketch that combines all the possible ways to plot cos() and sin() into x and y. Comparing the similarities and differences between them might help you gain a deeper understnding on how to use them:
Link to Source CodeText Along the Curve
Now that we've learned the basics of drawing things on the radial path using sin() and cos(), let's use this knowledge to draw text along a curve so that we can create a more surprising and engaging reading experience for our readers.
Let's start with a simple example of placing text around a circle. First, we need to use JavaScript split() to break the string into an array of chars.
Next, let's use the polar - cartesian conversion equations to draw each of the item in sentenceArray:
When you hit play, you should see all the letters from the array overlapping on top of one another. We need to add a rotate() inside the for Loop to rotate each letter in place:
Now, your sketch should looks like THIS. We're getting close, however I'd like to rotate each of the individual letters so that the bottom of each letter would be facing towards the center. My intuition tells me that we need to use a push() and pop() in here in order to do that. And also it would make things a lot cleaner, if the x and y positions for our text are (0,0). Let's do a small reinvention of our existing code based on these guesses:
Try to comment out individual lines in this example code to process how each line is affecting the outcome. Here is the final output:
Using sin() and cos() to draw the curve in your head isn't easy and it will take a little while to feel like you've comprehended it. The best way to go forward is to look at the example code, try commenting some lines out to see how they work. And try building your own through an iterative process — start with a simple sketch and add complexities through revisions. Here are a couple more examples that were built off of the last example: